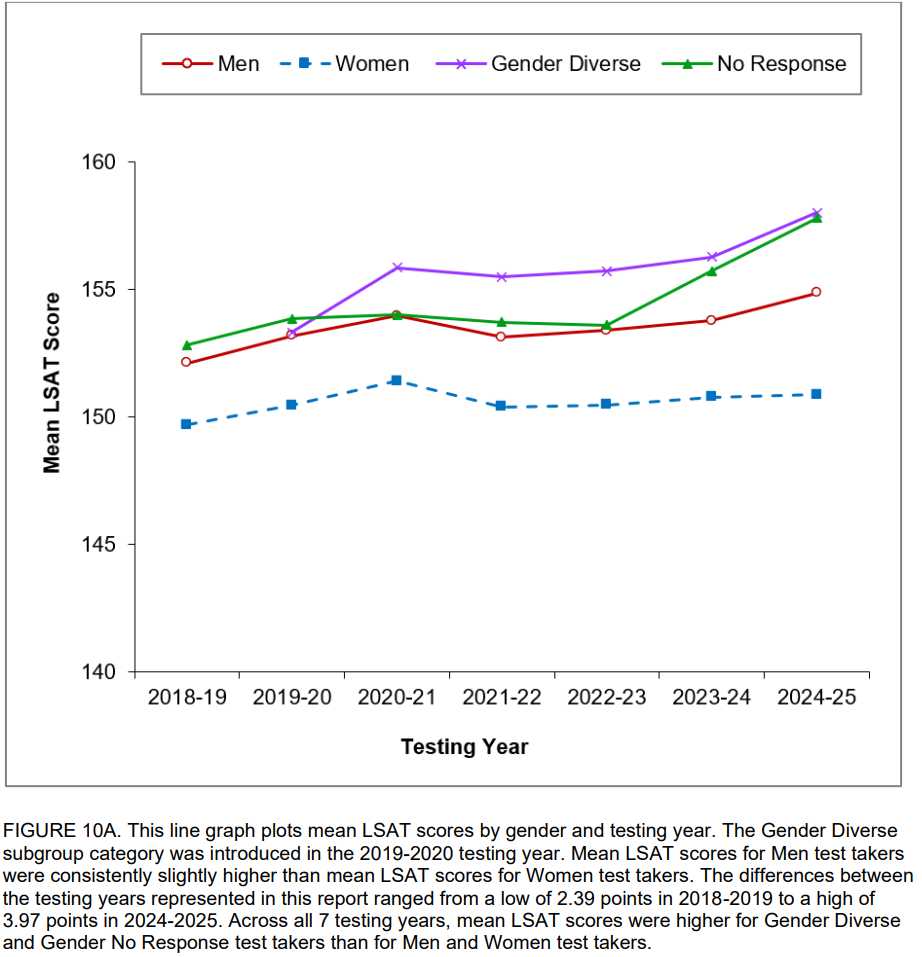
https://www.lsac.org/sites/default/files/research/TR-26-01.pdf The LSAT publishes test related data in reports regularly. In 2024, as a part of a settlement for an ADA claim by 2 blind test takers that the logic games section of the LSAT was discriminatory, they removed that portion of the test. It relied heavily on diagrams and the test creators could not create a version of that test segment that did not rely on diagrams. The LSAT score you get influences your admissions likelihood, because average admissions by a school dictates what they can advertise about their incoming class, which is one of their key marketing mechanisms. Typically students spend several thousand dollars in test preparation, and if you're vaguely competent and invested, you can bump your score by 10 points just by taking training courses and practice tests. The reason to do so is scholarship money--it's an excellent return on investment. You can get a lot of this prep material for free. One major criticism of the test has been that it reflects willingness to do practice tests and prepare, rather than any native ability, but obviously that critique is actually a decent indicator for estimating performance due to motivation and work ethic. The logic games section in particular had outcomes similar to logic games research for dementia prevention--what they ultimately learned from the studies on making the elderly do a bunch of logic games was that they made the elderly good at games with practice, so their data related to cognitive ability protection wasn't actually indicating they were protective against age-related mental decay.
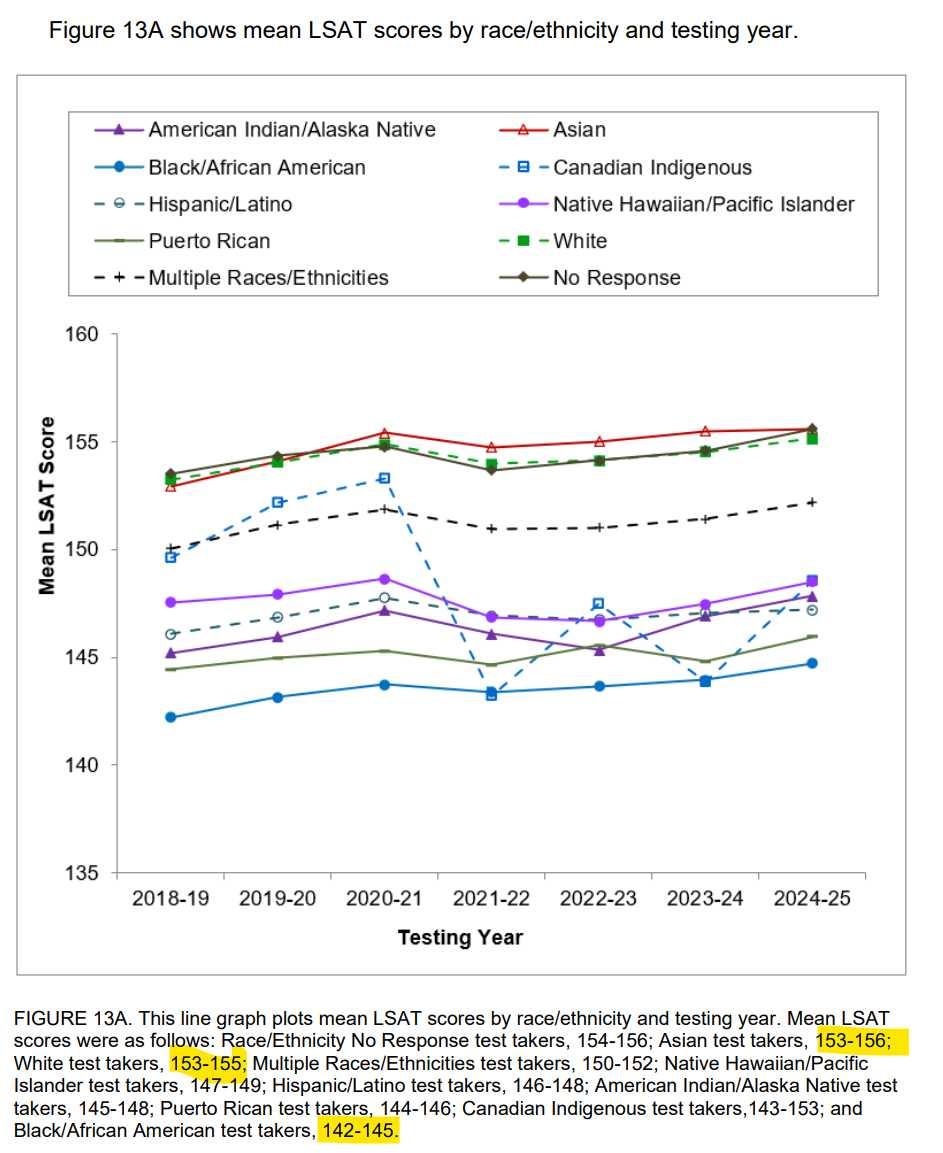
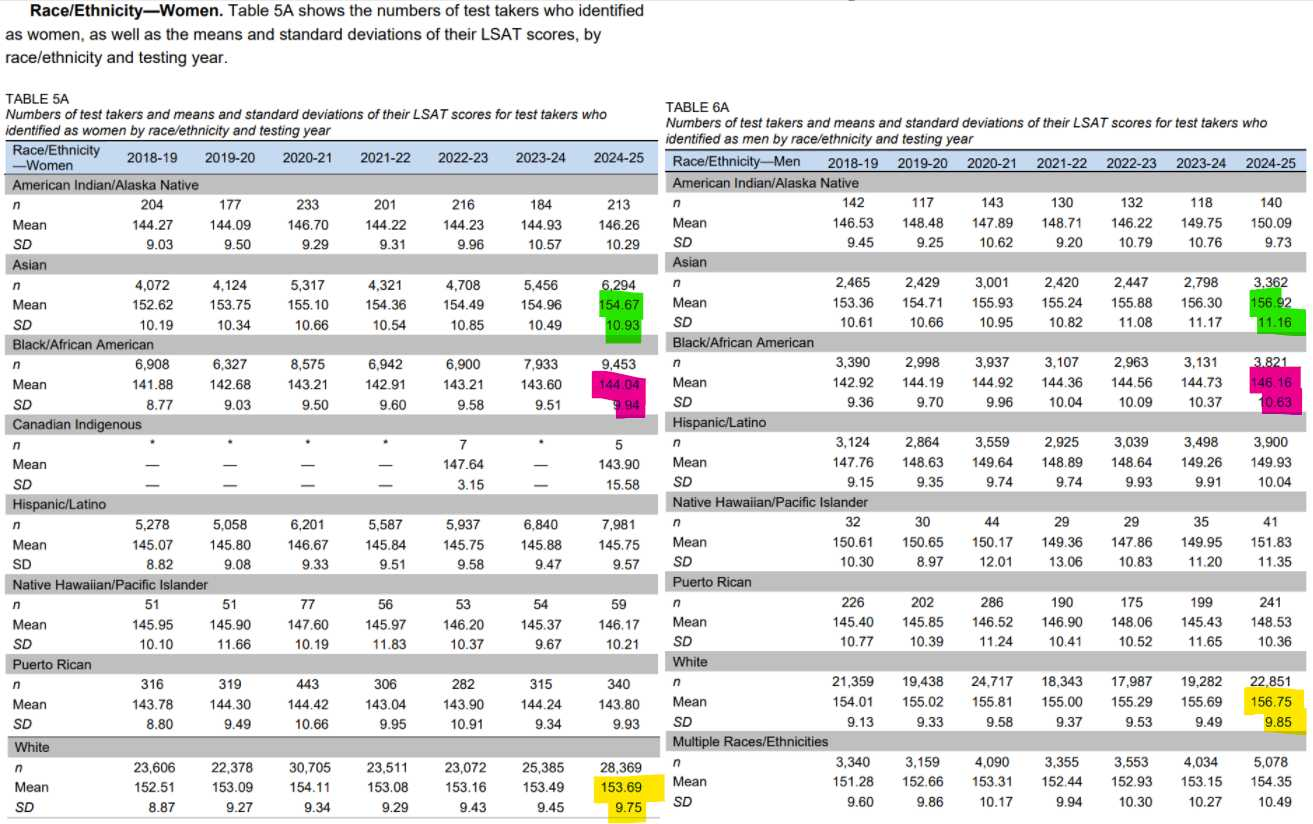
Anyways, men consistently score higher than women, and removing the logic games section, which was highly subject to the score being improved by practice, doubled the disparity between male and female test takers. Interestingly, this new version of the LSAT basically translated to the average score going up by 2 points. What I had not realized before looking at this data is exactly how much lower black test takers score than whites and asians. The bottom rung for the test is 120, top score is 180. In Figure 3, I put the tabular data for men versus womens' scores by race. In IQ, it is commonly understood that men have a wider range, i.e. their bellcurve is stretched compared to that of women. This is borne out by the standard deviation difference in the test scores. Another shocking part of this table confirms something anyone who notices might have observed in real life, black women (and apparently Puerto Rican women but because they're coming from effectively another country, another school system, I don't care about this data point) score the lowest of all test takers. Black men and women score 10 points lower than white and asian prospective law students.
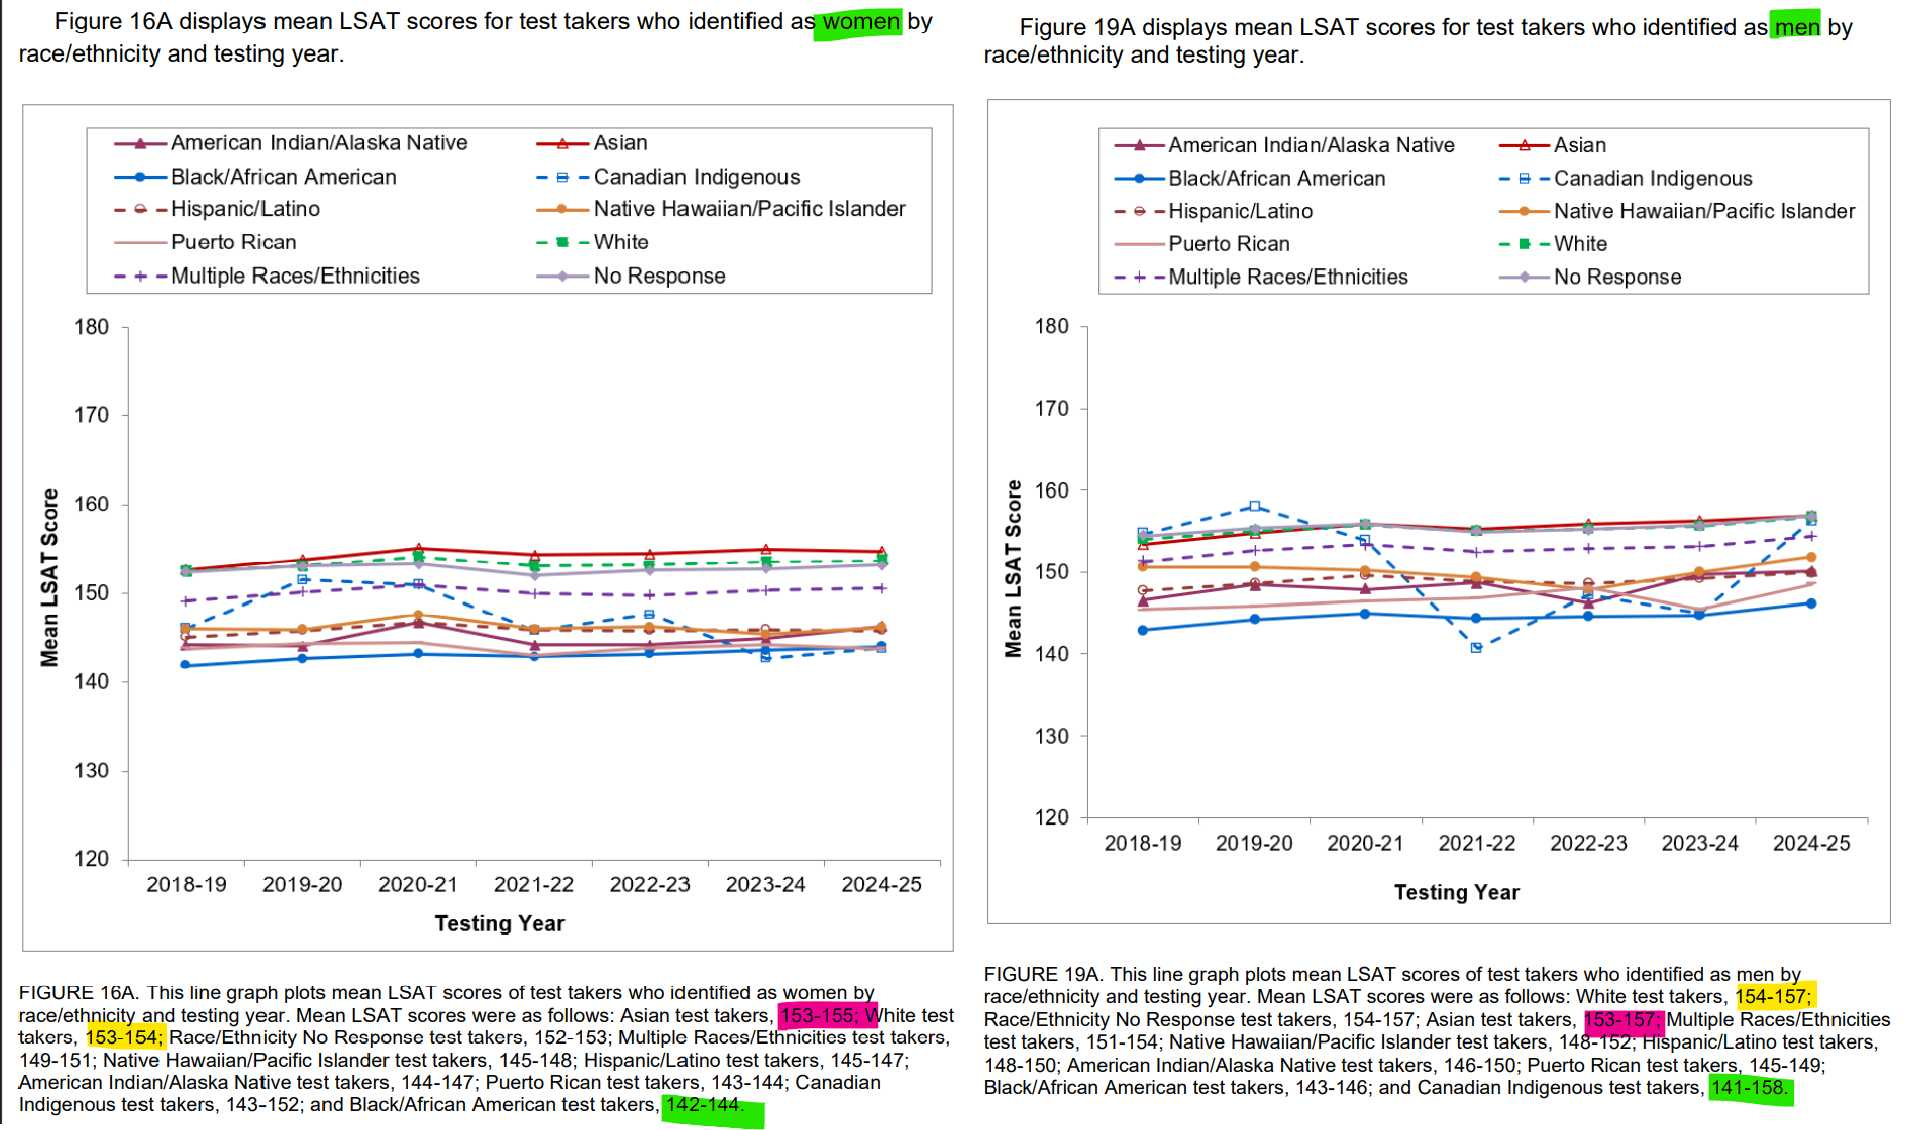
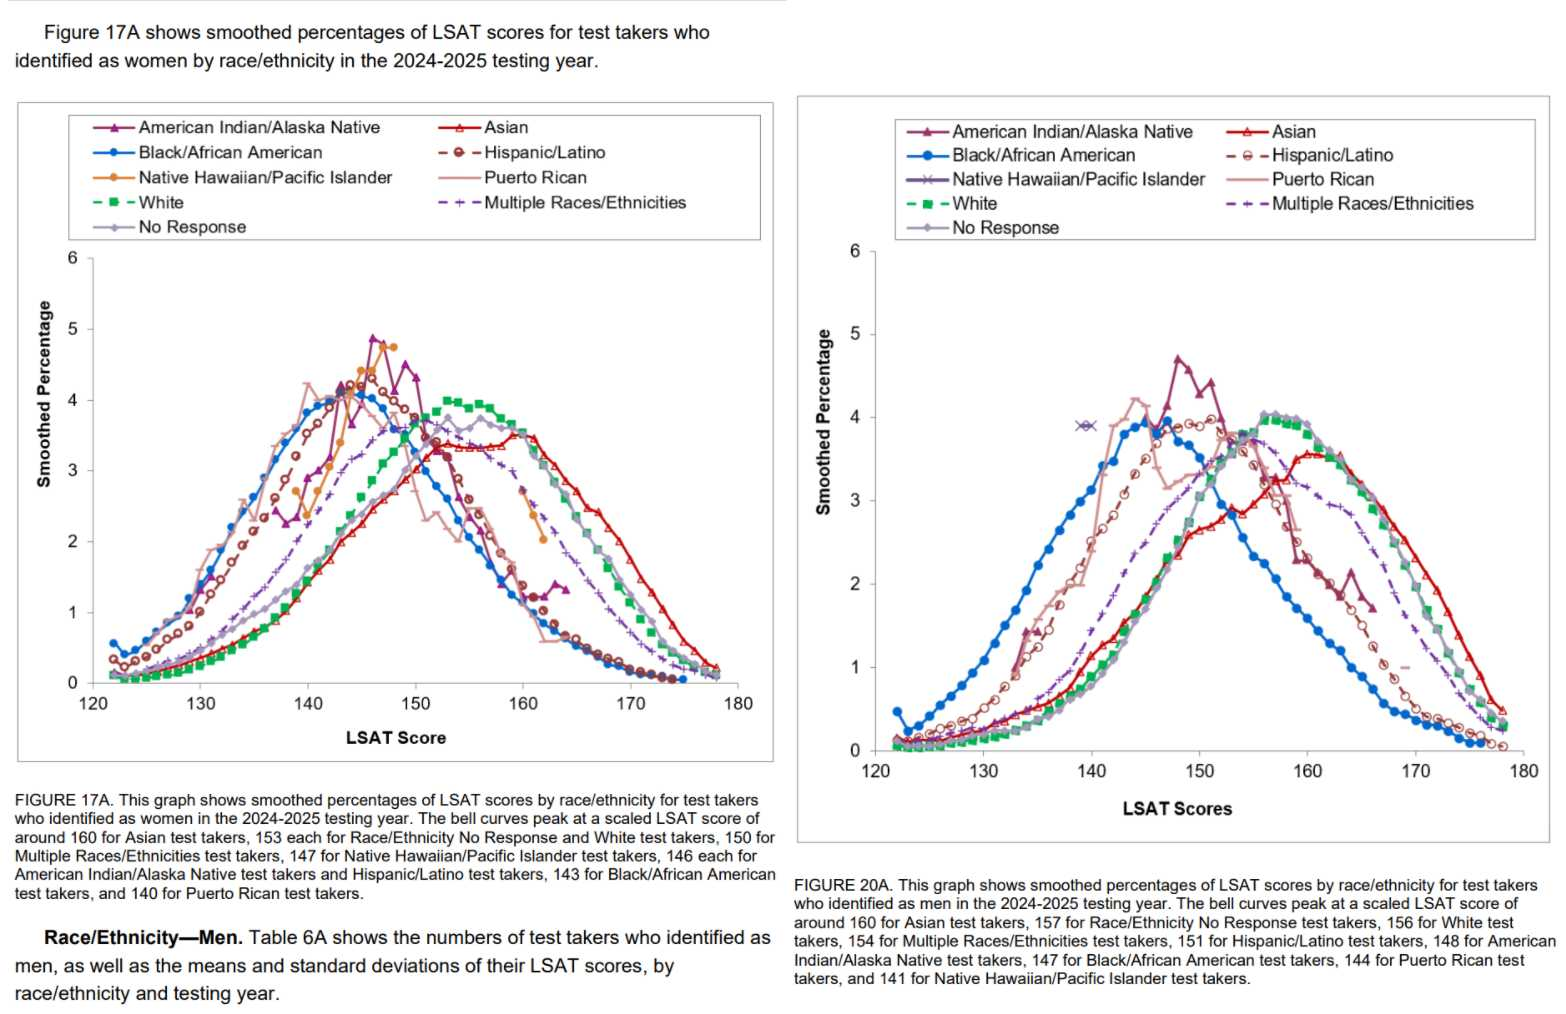
In Defunis vs. Odegaard (1974), which is a case commonly used to teach "mootness", during oral arguments the student's lawyers introduced the test score disparity between the Jewish student denied entry to an Washington state school because of affirmative action. Effecyively his spot was given to a minority student even though his numerical scores were better than basically every single minority student in the admissions pool for that year. And it wasn't even close, if I recall correctly, the numbers introduced indicated that none of the minority students would have been admitted by test score if minority status hadn't been considered by the Admissions council. For those visually inclined, I included the graphical comparisons in score in the fourth figure. You can see the distribution comparison in the fifth figure, and I think that one is interesting because the comparative shapes of the scores is different, meaning that around the peak of the hump the women's scores are more rounded, compared to a more peak shape for the men, which is the visual representation of the discrepancy in standard deviation, but also means women as a whole are grouping more around that peak. Also interestingly, you get more of a wave shape for the white test takers, and the Asian test takers almost has two humps in it, which I suspect is driven by an improper demographic category, because Indians and Southeast Asians are being grouped with Chinese, Korean, and Japanese Asians, and these groups are incredibly diverse. Another interesting point, is that you can clearly see that students that selected the "choose not to respond" point for demographics information are either white or asian by test score, given where their averages track. It's probably a combination of both--which means anyone using that data is probably just going to assume it's some mix of the two. Because it's an advantage to mark black for admissions, and a disadvantage to mark white or asian.
Anyways. I thought the data was interesting. I hadn't realized exactly how much lower black applicants were scoring on the whole. The reason the Defunis v. Odegaard case really irritated me was that it was a Per Curiam decision, meaning no one on the Supreme Court wanted to put their name to it--a spineless move that shouldn't be permitted. They're on the Supreme Court. It's a lifetime appointment. They don't get to hide behind anonymity as a group. They knew it was illegal on its face for schools to racially discriminate. They knew it violated the Civil Rights Act. They knew Defunis had his civil rights violated and that even if for his particular case it was moot, it wasn't moot for thousands of prospective students going into the future--this opinion was published 52 YEARS ago. They let this go on for nearly 50 years. And it was a cop out. This is why I have no respect for the Supreme Court. That case ticked me off so much that I read the entire opinion and pulled the oral arguments recording for it, even though it was only mentioned in passing in the textbook. The mootness issue only came up 2 days before the oral arguments were heard--which meant that the SC was going to rule on affirmative action, and the school publishing a statement that it would let him graduate let them choose not to publish an opinion on this issue. The school's statement didn't hold any legal value--Defunis wouldn't have been able to sue based on the statement if they had reneged and kicked him out his last semester. This case was a really good reminder that when you're looking at historical cases, you need to pay attention to the timing of when things happened, because timing can dictate your outcome.
Edit: I was going about Saturday morning errands and it occurred to me that the distribution curve of the black test takers might include African immigrants, as in Nigerians, and their children, which pull from a different class and cultural group. So you could have a similar effects to the Asian group as having miscategorization making the mean data somewhat less valid in drawing conclusions.
2 more points that occurred to me--these are all college graduates. So they were already subject to affirmative action in college admissions. Which means what should have happened is that if you could correct for public education deficiencies due to growing up in black concentrated areas with lower socioeconomics, then it already would have been corrected for by a 4 year degree. Does that mean school can't correct for it? Because you can't blame being poor forever. Poor people can learn to read and think well with opportunity just as well as anyone else. Why are we doing double affirmative action admissions when it didn't work the first time, based on test scores?
Third, when you look at black populations they're basically maximum density in urban areas. They also vote Democrat at incredibly high rates. Like 90% vote D. And in places like Baltimore, they've had Democrat mayors for over 50 years. So if their public schools aren't capable of bringing them to parity with whites and Asians, what does that mean about public schools in general? Doesn't this mean performance in education institutions are set by culture along racial lines? Which means schools don't have an impact on education outcomes, families do?